

When It Comes To Potholes, Does 1 Road In Utica Take The Cake?
Spring is here, and so are potholes. Could this Utica road have the most?
They Are Everywhere

With the winter salt eating away at the roads, springtime in the Empire State brings potholes. Some roads, of course, are a little more impacted by them than others. But, Jay Street in Utica might just have more than any other.

While Jay Street may not be the longest, it also isn't the most heavily traveled, but it easily is one you'd like to avoid if you could. If you're heading down Oriskany Boulevard and veer left onto Jay Street, you're instantly greeted by unavoidable potholes.
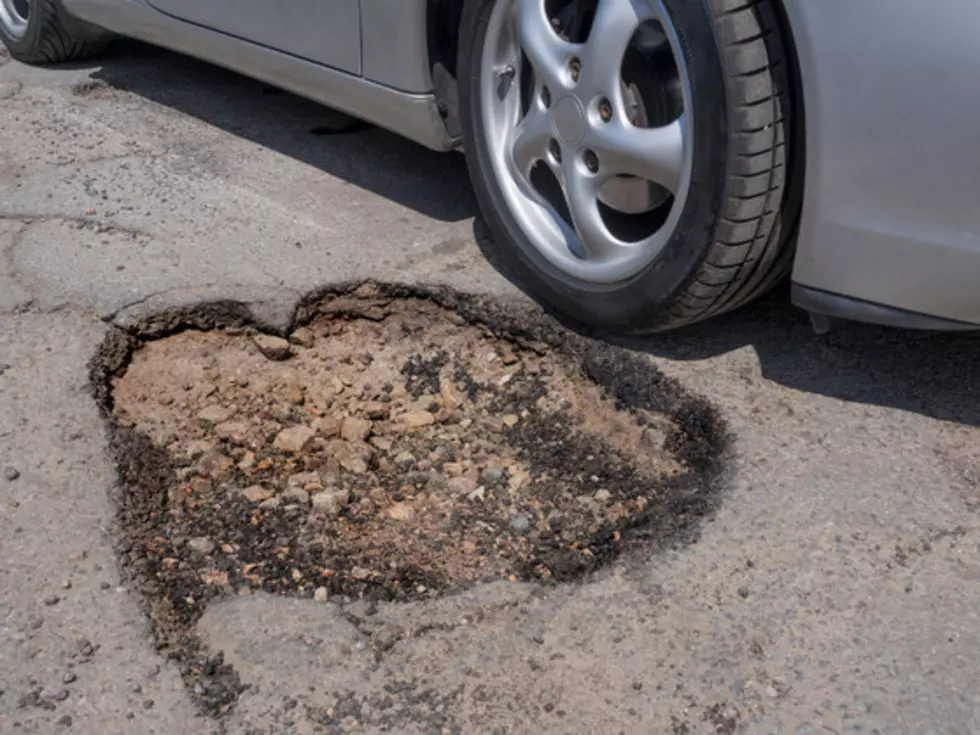
Just Look At Them

It is easy to see why Utica might not have a street with this amount of travel high on their priority list, but man could that ruin some suspension components on cars.
How Good/Bad Is New York In General For Potholes?

If you look at the entire state as a whole, we sure don't fare too well when it comes to our road conditions. In fact, we are in the 10th spot in the United States for states with the biggest pothole problems. But why would we fair well? So many municipalities in the winter months coat the roads in salt which does degrade asphalt. Plows will come by and it can cause havoc.
What States Have It Harder?
Here is the list according to Autoblog.
- Washington
- Indiana
- Michigan
- Nebraska
- Ohio
- Massachusetts
- Illinois
- Tennessee
- Pennsylvania
- New York
Do you know of a road in Central New York with more potholes than Jay Street? Let us know and show us your pictures through our free station app.

11 of Worst Roads in Central New York
Gallery Credit: Credit - Polly McAdams
23 Of The Oddest And Funniest Road Names In Central New York
Gallery Credit: Vinnie Martone
14 More Roads In The Utica-Rome Area Everyone Hates
Gallery Credit: Vinnie Martone
50 Most Popular Chain Restaurants in America
Gallery Credit: Paul Feinstein
LOOK: Here is the richest town in each state
Gallery Credit: Meagan Drillinger
KEEP READING: Here are the most popular baby names in every state
Gallery Credit: Stacker
LOOK: The most expensive weather and climate disasters in recent decades
Gallery Credit: KATELYN LEBOFF
READ ON: See the States Where People Live the Longest
Gallery Credit: Hannah Lang
More From WIBX 950


![Utica Police Investigate Homicide On Jay Street [UPDATE]](http://townsquare.media/site/41/files/2015/02/UPD-Car1-300x2252.jpg?w=980&q=75)